Overall, commercial real estate in Boston is thriving and there is an abundance of new developments and real estate opportunities for brokers, tenants, landlords, and investors to capitalize. BizJournals recently highlighted why Boston’s commercial real estate market remains robust moving into 2019. Of the many reasons listed, the greatest factor is the stability of the economy over the last 40 years in contrast to many markets across the United States. The analysis concludes that “overall, the future for Boston CRE will provide healthy competition for brokers and tenants alike.”
More specifically, Boston is considered to be among the most competitive industrial real estate markets in the country. It is seen as a prime location with opportunities for both investors and tenants due to its positive market fundamentals and bourgeoning sectors, such as: biomedical, healthcare, education, technology, and finance.
In fact, National Real Estate Investor ranked Boston’s warehouse market 11th nationwide in a recently published list of “Warehouse Markets with the Most Rent Momentum.”
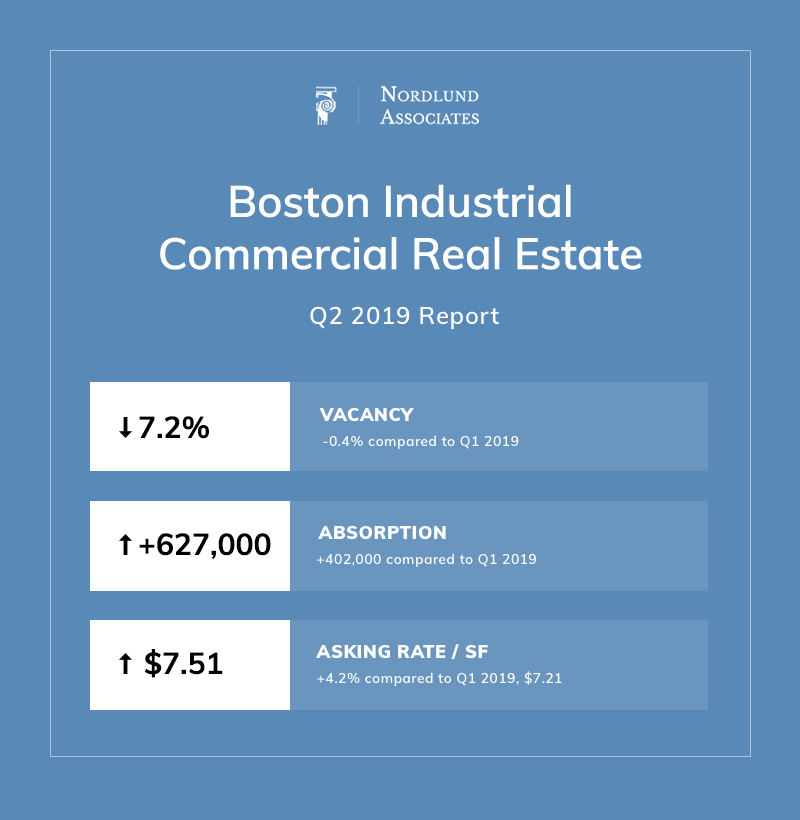
Demand for industrial real estate in the Greater Boston area remains high, especially for well-situated distribution spaces and high-end manufacturing spaces. Led by the expanding biopharmaceutical industry, tenants have absorbed a total of 8.9 million SF of industrial space over the last 6+ years (since 2012).
The overlying theme in Q2 2019 is how tight the industrial real estate market is north of Boston. This is specifically illustrated by the stats listed for the industrial real estate properties in the North Shore area.
“Over the past few years industrial real estate has become increasingly competitive, vacancy rates have steadily declined to a low single digits number in Metro Boston and the suburbs surrounding, thus driving prices upward with this lack of inventory. We’ve seen these factors create an opportunity for new construction & development, firms willing to develop property or scrape existing dated structures, that were previously considered prohibitive due to incurring higher construction costs.
There are several driving factors which have played a role in this scarcity, Greater Boston and the suburbs have one of the most dynamic & diverse collection of industries such as Healthcare, Tech, and Education. The rise of E-Commerce, the retail model and its relationship with consumer has changed tremendously over the last five years, creating opportunity for fulfillment centers as well, with their shipping & receiving demands.”
– Kevin Olson, Nordlund Associates Inc.
1) Warehouse – 43%
2) Flex – 20%
3) Manufacturing – 19%
4) High Bay (24′ Clear Heights) – 18%
A list of industrial properties currently under construction in the Boston area. Most of these projects are set to be completed within the calendar year in 2019.
1) 333 Coney St – Siemens Expansion (Route 495 South Industrial Market)
RBA: 300,000
Preleased: 100%
Delivery Date: Q2 2021
Developer: Siemens Healthcare Diagnostics Inc
2) 100 Financial Park (Route 495 South Industrial Market)
RBA: 300,000
Preleased: 0%
Delivery Date: Q3 2019
Developer: Unknown
3) 237 E Main St – Building 5 (Attleboro / New Bedford)
RBA: 258,000
Preleased: 0%
Delivery Date: Q3 2019
Developer: Condyne LLC
4) 20 Commerce Way – Alnylam (Attleboro / New Bedford)
RBA: 200,000
Preleased: 100%
Delivery Date: Q4 2020
Developer: Gilbane Development Company
5) 237 E Main St – Building 7 (Attleboro / New Bedford)
RBA: 130,000
Preleased: 0%
Delivery Date: Q3 2019
Developer: Condyne LLC
A list of the top industrial sales transactions in the Boston area during Q2 2019. The top sale in Beverly, Massachusetts sold for over $75 million, while a property on W First Street in Boston sold for $1,717 per square foot.
1) 108 Cherry Hill Drive (Beverly, MA)
Price: $76,000,000
PSF: $193
Buyer: Broadstone Real Estate, LLC
2) 30 Superior Drive (Natick, MA)
Price: $51,700,000
PSF: $299
Buyer: Bentall Kennedy
3) 159 Rangeway Rd / 400 Charter Way (Billerica, MA)
Price: $25,500,000
PSF: $176
Buyer: Store Capital Corporation
4) 370 W First Street (Boston, MA)
Price: $25,000,000
PSF: $1,717
Buyer: Oxford Properties Group
6) 1 Kay Way (Stoughton, MA)
Price: $17,250,000
PSF: $165
Buyer: Morgan Stanley Real Estate
4) 330 Ballardvale Street (Wilmington, MA)
Price: $9,157,725
PSF: $213
Buyer: Angl Jerky LLC
A list of top industrial leases signed during 2018 in the Boston area. The property at 419 Maple St is the largest with nearly 500K square feet of leased space by BlueLinx.
1) 419 Maple St (I-95 Corridor South Ind)
SF: 489,950
Tenant: BlueLinx
Landlord: Unknown
2) 64 Jackson Rd (Ayer Ind)
SF: 355,000
Tenant: Quiet Logistics
Landlord: Newmark Knight Frank
3) 305 Forbed Blvd (Attleboro / New Bedford Ind)
SF: 302,032
Tenant: Rolf C Hagen (USA) Corp
Landlord: CBRE – New England
4) 66 Saratoga Blvd (Ayer Ind)
SF: 261,982
Tenant: Gillette Eastern Distributors
Landlord: CBRE – New England
5) 55 Lyman St (The Boroughs Ind)
SF: 260,760
Tenant: McKesson Corp
Landlord: CBRE – New England

Nordlund Associates conducted a study of industrial and flex space properties within a 5 mile radius of North Shore Massachusetts to get a better idea of this specific zone in contrast to the whole Boston metropolitan area. Although rates are a bit higher around North Shore ($10.46/ SF vs +$7.51/SF) on average, the vacancy rate is also lower by over 50%: 3.9% vs 7.2%, respectively.
The big takeaways are the asking price at $10.46 (+8.6% compared to Q1 2019 at $9.62), and the market sales price / square foot which increased 10% from quarter-to-quarter to $105 / SF (compared to $96 / SF in Q1 2019).
These help illustrate how tight the industrial/ flex market is in the Massachusetts’ North Shore area and how desirable properties are in the area.
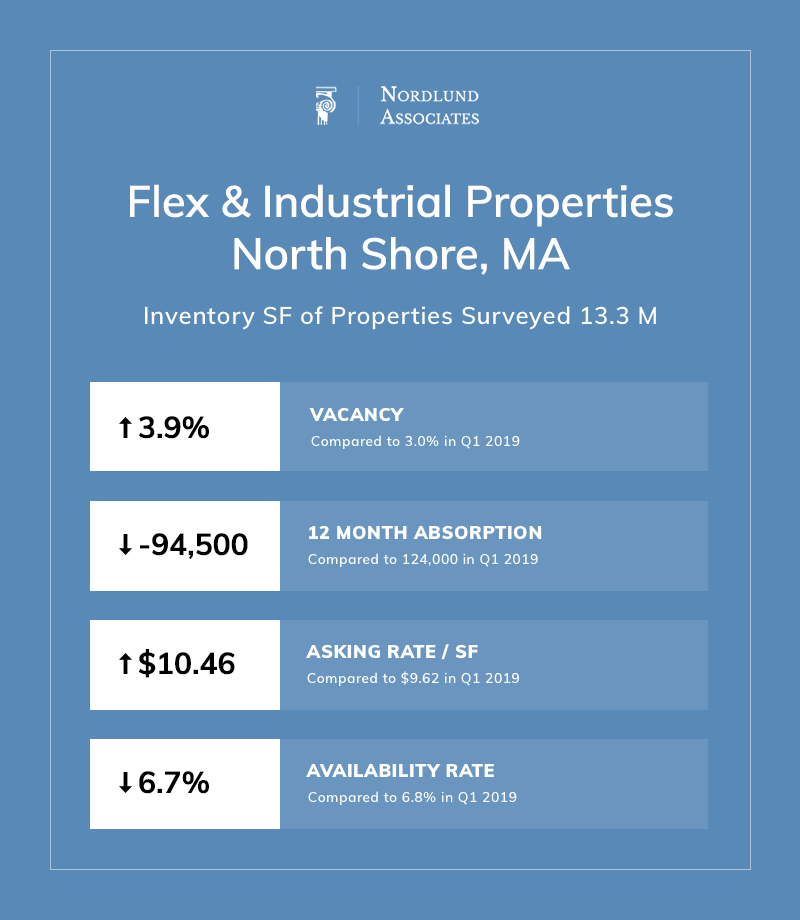
*Inventory SF 13.3 M
1) System7 – 48 Dunham Road (Beverly, MA)
Description: System7 is the first tenant occupying the Class A asset completed in Q4 2018
SF: 145,000
2) The Hanover Company – 269-271 Mill Road (Chelmsford, MA)
Description: The Hanover Company acquired the industrial property for $35 million
SF: 268,000
Price/ SF: $132
3) Symes Associates – 99 Rosewood Drive (Danvers, MA)
Description: Symes Associates purchased the property in Danvers for $7.2 million
SF: 74,000
Price/ SF: $97
Data sources: Steel by CoStar, Perry Brokerage, Colliers, & Nordlund Associates